
The Most Expensive Property Decision in Singapore Isn't Buying the Wrong Condo.
It's Buying the "Safe" One.
Two families were days away from a $300,000 to $430,000 mistake.
One set of data changed their decision, and they ended up in homes they love with six-figure gains most upgraders will never see.
The Most Expensive Property Decision in Singapore Isn't Buying the Wrong Condo.
It's Buying the "Safe" One.
Two families were days away from a $300,000 to $430,000 mistake.
One set of data changed their decision, and they ended up in homes they love with six-figure gains most upgraders will never see.
Every family looking to upgrade hits the same wall:
The property your family would love living in doesn't look like a strong investment.
The "smart investment" every agent recommends means compromising on space, location, or both.
So you do what feels responsible: you look for something in the middle.
But what if I told you that this is the most expensive decision you can make?
In practice, the middle means paying new launch prices for a development you're not excited about.
A unit smaller than your family needs. Banking on appreciation the data says is unlikely to materialise.
You end up in a home you tolerate rather than love.
And when you sell in five years,
you discover a different property, available at the same time, at the same price, would have delivered $300,000 to $430,000 more while giving your family the space it actually needed.
You'd never know.
The gap is invisible because it's measured against a decision you never took.
The two families on this page were days away from making exactly this compromise.
Here's what the transaction data showed them instead.
Who's behind this, and why 500 families trusted the framework

Hi, I'm Rodney Tan.
A top 0.5% property consultant at JNA Real Estate, and over 500 families have used my framework to make their upgrade decision in the past 6 years.
Every dollar of downpayment these families put in has grown at 19.7% per year on average.
But none of that matters until you see how the framework actually works, so let me show you two families who were days away from a six-figure mistake.
The private banker who almost got it wrong

Ms. Tan is a private banker at DBS.
Her day job is telling clients with 8-9 figure net worths where to put their capital.
When she sat down to discuss her own property purchase, she had already done her homework.
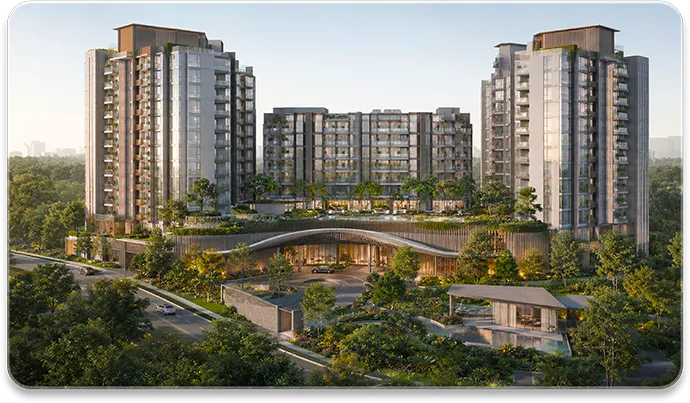
The property she wanted was Woodleigh Residences.
➡️ Integrated development.
➡️ MRT station directly below.
➡️ Bidadari township rising around it.
➡️ Reputable developer.
➡️ City-fringe address.
On paper, everything a finance professional would look for.
Here's what the numbers actually showed.
Integrated developments in Singapore have a documented pattern of underperforming on capital appreciation.
The MRT, the mall, the convenience.
These feel like advantages on viewing day.
But they're typically already priced into the launch price.
The developer collects that premium upfront. What looks like a head start is actually a ceiling on the property's future value.
Woodleigh had a second problem.
It was about to face direct resale competition from Park Colonial, The Tre Ver, and other nearby launches at lower PSF.
When she eventually wanted to sell, her buyer pool would be comparing three similar options in the same postcode.
Hers would be the most expensive.
From a risk standpoint, there were better options on the market at that time.
I told her not to buy it.
The pushback was instant, and it was the same pushback I hear from every analytical buyer:
"But the MRT is right there. The mall is right there. The township is being built around it. How can the math say no?"
The math said no... because the math was not looking at the same things she was looking at.
I recommended a 4-bedroom unit at Amber Park in Tanjong Katong instead.
No MRT at the time of purchase.
No integrated mall.
No township story.
On every conventional checklist, Amber Park was the weaker property than Woodleigh Residences.
But on my one checklist that actually predicts capital appreciation, Amber was the better one by a wide margin.
She almost walked away from the recommendation.
Her entire professional instinct was telling her the integrated development was safer.
Eventually, she trusted the objective analysis over her own raw instinct.
Today, Ms Tan is sitting on $600,000 in capital gains from that Amber Park unit.
The Thomson-East Coast Line has since opened in the area.
Tanjong Katong's supply has tightened exactly as the framework predicted.
The unit type she bought has compounded cleanly.
The Woodleigh unit she nearly bought: roughly $300,000 over the same period.
Same capital and holding period. A good $300K less.
Anyone who bought Woodleigh Residences would look at their gains and feel good.
It made money for the people who bought it.
Anyone who purchased there would have looked at their current property value and felt good about their decision.
After all, it's still $300K gains.
They'd have no reason to check whether a different property would have paid them double.
If a private banker whose career is built on capital allocation needed someone else to show her what the data actually said about her own property decision...
The question isn't whether you're smart enough to figure this out alone.
It's whether anyone has shown you what to look for.
A different family. The same pattern.
The DBS banker had decades of financial training.
But this framework isn't about sophistication. It's about looking at variables that standard advice doesn't cover.
A young couple with 2 children.
Wife is an MOE teacher, husband is a songwriter.

$600,000 in BTO sale proceeds.
That money represented everything they had.
They were 48 hours from putting it into a 3-bedder at Verticus or Irwell Hill Residences.
Both popular new launches located in prime locations (Great World & Balestier respectively)
Both being recommended to thousands of upgraders across Singapore.
They were about to make the compromise:
Take the smaller unit in the more "impressive" location.
No study. No helper's room. No space to grow into as the kids get older.
Maybe the returns make up for it in a few years.
My analysis said no to both.
I recommended a 5-bedroom unit at Treasure at Tampines instead.
Not a prestigious address.
Not a name that turns heads when you mention it.
But five bedrooms meant a study, a helper's room, and space for the family to actually grow into.
Not just a layout they'd feel squeezed in before the kids started primary school.
And the data behind the unit was clear.
3.5 years later in March 2025, I helped them exit that unit for...
just under $700,000 in capital gains.
They took that gain plus their original proceeds and put the deposit on a $3.2 million 4-bedder at Nava Grove.
A family that started with $600K from a BTO is now in a $3.2 million home.
That move would have been impossible if they'd followed standard advice and squeezed into a 3-bedder three years earlier.
The two properties they almost bought:
approximately $270,000 and $406,000 in gains.
$300,000 to $430,000 less in a smaller home their family would have already outgrown.
Why I see property differently.

I didn't learn this from a course. I learned it by watching two people make opposite property decisions over 20 years.
My father's business was in a sunset industry. He knew it wouldn't last.
So while he was still earning, he bought three industrial units.
Two units and a shop.
Not glamorous. Not the kind of property anyone talks about at dinner.
When the business wound down, it didn't matter.
Those three units generate over $20,000 a month in rental income today. No employer, no CPF drawdown. That's his retirement.
My mother's path went the other direction.
After the divorce, every time she needed cash, she sold and downsized.
Executive maisonette first. Then a 5-room flat. Then 4-room. Then 3-room.
Today she's in that 3-room flat with an outstanding mortgage, still working.
Their situations weren't equal. I'm not pretending they played the same hand.
But one thing stayed with me.
My father never bought what looked impressive.
He bought what the numbers said would perform.
Property built his wealth. For my mother, it did the opposite.
I kept asking myself: what actually determines whether a property builds wealth or just stores it?
Because the standard answers I kept hearing from the industry didn't explain the gap.
That question is what sent me into the transaction data.
Thousands of residential sales across multiple market cycles, looking for one thing:
what actually separates the properties that outperform from the ones that just look like they should?
What I found were 7 signals.
They predicted appreciation more reliably than location, MRT proximity, developer reputation, or freehold status.
These are the signals that told me Amber Park would outperform Woodleigh before the market confirmed it.
And Treasure at Tampines would outperform Verticus before the numbers came in.
I've documented all seven in a blueprint for families facing these decisions right now.
Introducing: The $700K Property Blueprint
7 Hidden Signals Behind 19.7% Annual Profit on the Downpayment Alone
In this comprehensive, data-backed blueprint, I'll reveal:
👉 Why certain unit types consistently outperform others by 300% in the exact same development, and how to identify which ones before you commit
👉 How developers price in years of future appreciation before you even get your keys, creating a ceiling on your returns that most buyers never calculate
👉 The floor premium trap: developers charge $5,000 to $44,000 per floor, but resale buyers almost never pay you back that difference
👉 How specific supply dynamics in a postcode can predict whether your property appreciates or stagnates, years before the market catches up
A PROVEN TRACK RECORD OF LIFE-CHANGING RESULTS
When I recommend a property strategy, it's not based on theory or guesswork. It's built on verifiable results that have transformed hundreds of lives:
✅ 500+ investment clients with documented 19.7% annual growth on their downpayment – outperforming typical Singapore property appreciation rates of 5-10%
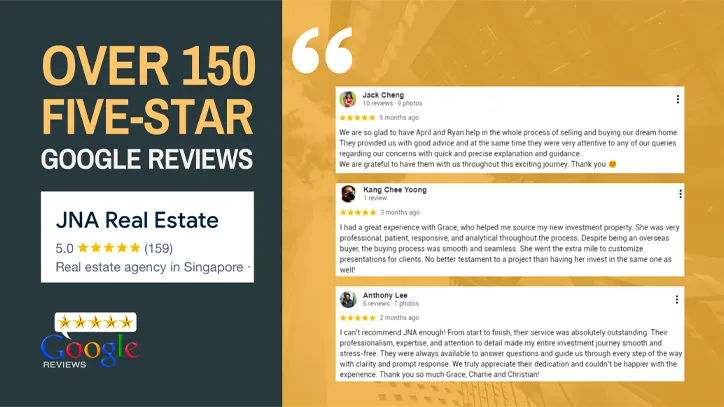
✅ Over 150 five-star Google reviews with detailed accounts from clients who followed our framework and achieved life-changing results
✅ Multiple documented case studies of $500K-$700K profits in 3-5 years – not from premium district properties, but from developments most people would never consider
✅ A YouTube channel with thousands of subscribers where we transparently analyze property opportunities using our framework – often advising AGAINST properties with huge commission potential because they lack the 7 critical signals

✅ Featured in prominent Singapore property publications as the agency with one of the highest client satisfaction rates in the industry
At JNA Real Estate, we built our reputation on one principle:
We put data and client outcomes above quick commissions.
When other agents are pushing "hot properties" with maximum marketing budgets, we're diving deep into transaction histories, analyzing price gap ratios, and calculating optimal unit size metrics.
This methodical, data-driven approach is why our clients consistently outperform the market, even during turbulent times.
Is this for you?

What the blueprint covers:
Each of the 7 signals, broken down with real transaction examples.
You'll see exactly what numbers to check, where to find them, and what they reveal about any development you're comparing.
It's built for you if:
You own an HDB or private property and you're planning your next move within 6 to 12 months.
Budget of $1.5M to $4M or more.
You know what PSF and MOP mean.
You're reading articles or watching Youtube videos, but you're still caught between properties that look like strong investments and properties your family would actually enjoy living in.
You can't tell which ones deliver both.
It's not built for you if:
you're years away from purchasing or browsing out of general interest.
This is for people comparing developments who need to decide.
If that's not you right now, bookmark this and come back when it is.
How the framework thinks

Most property advice focuses on what you can see at a viewing.
Finishes, facilities, floor plan, the view.
The 7 signals focus on what you can calculate before you step into a showflat.
One example.
Developers charge a floor premium of $5,000 to $9,000 per storey. Sometimes as high as $44,000.
A unit 10 floors up might cost $50,000 to $90,000 more than the same layout below.
The assumption is that you'll recover that premium at resale.
The transaction data says otherwise.
Resale buyers do pay more for higher floors.
But significantly less than what the developer charged you for that height advantage.
The gap never shows up as a loss. Just gains that should have been larger.
That's one signal out of seven.
Each works on the same principle:
where the market's actual behaviour diverges from what conventional wisdom tells you to expect.
The blueprint covers all seven with the transaction evidence behind them.
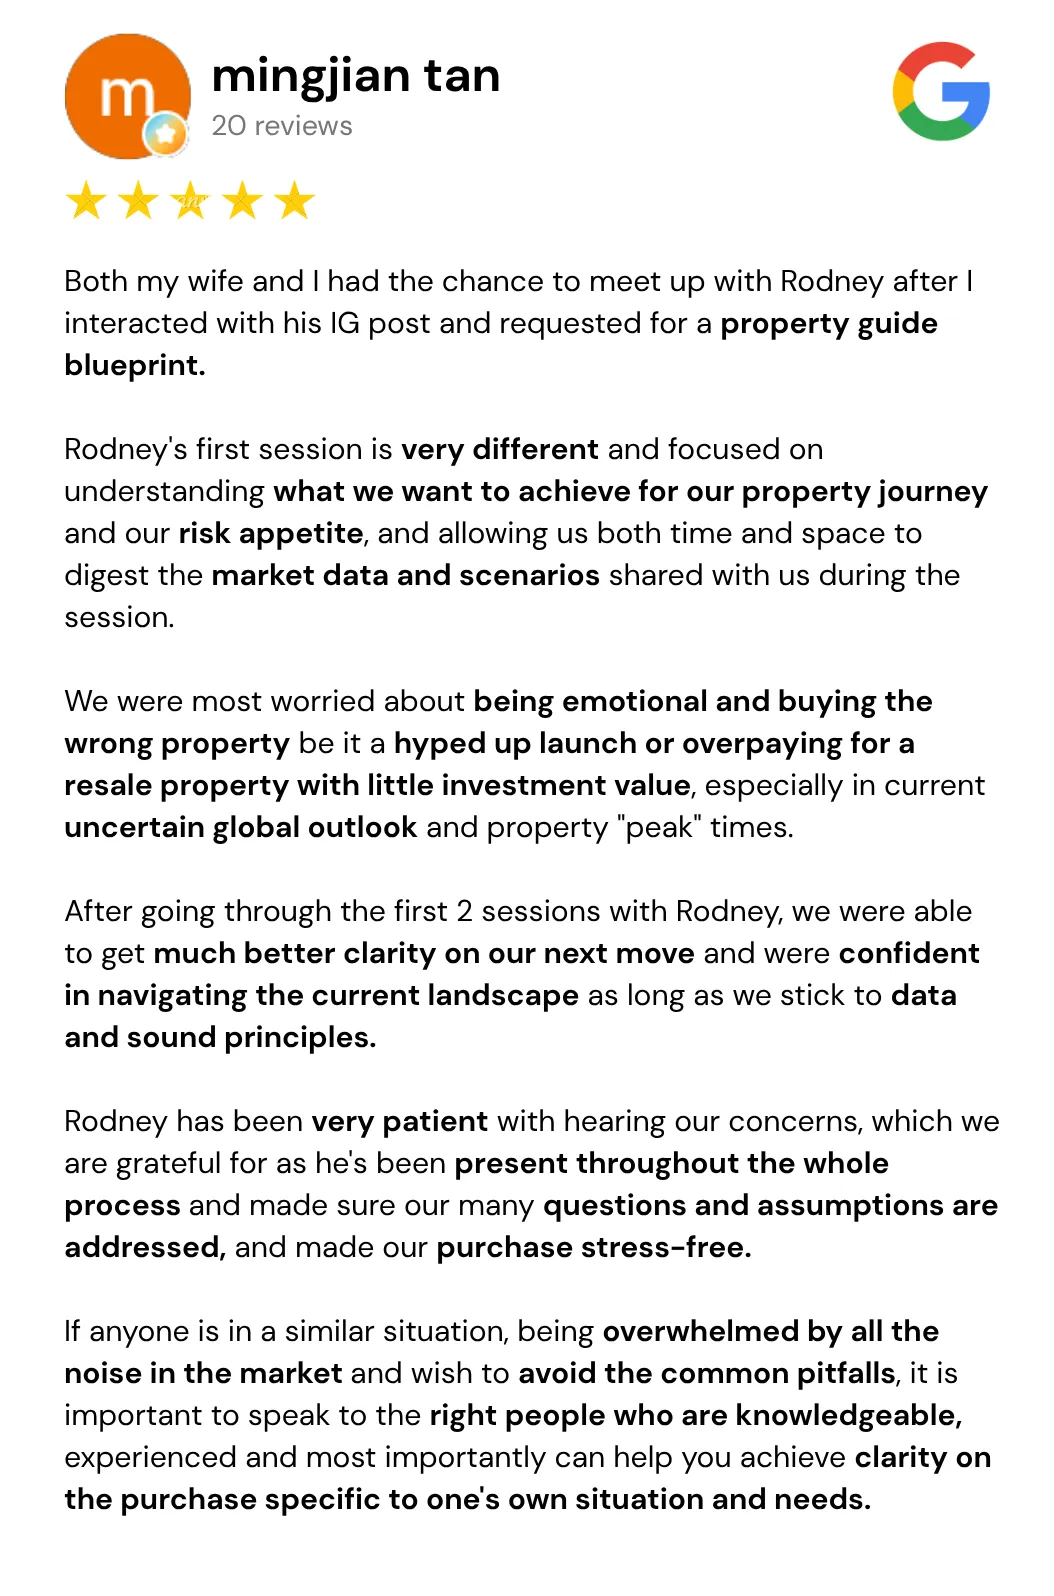
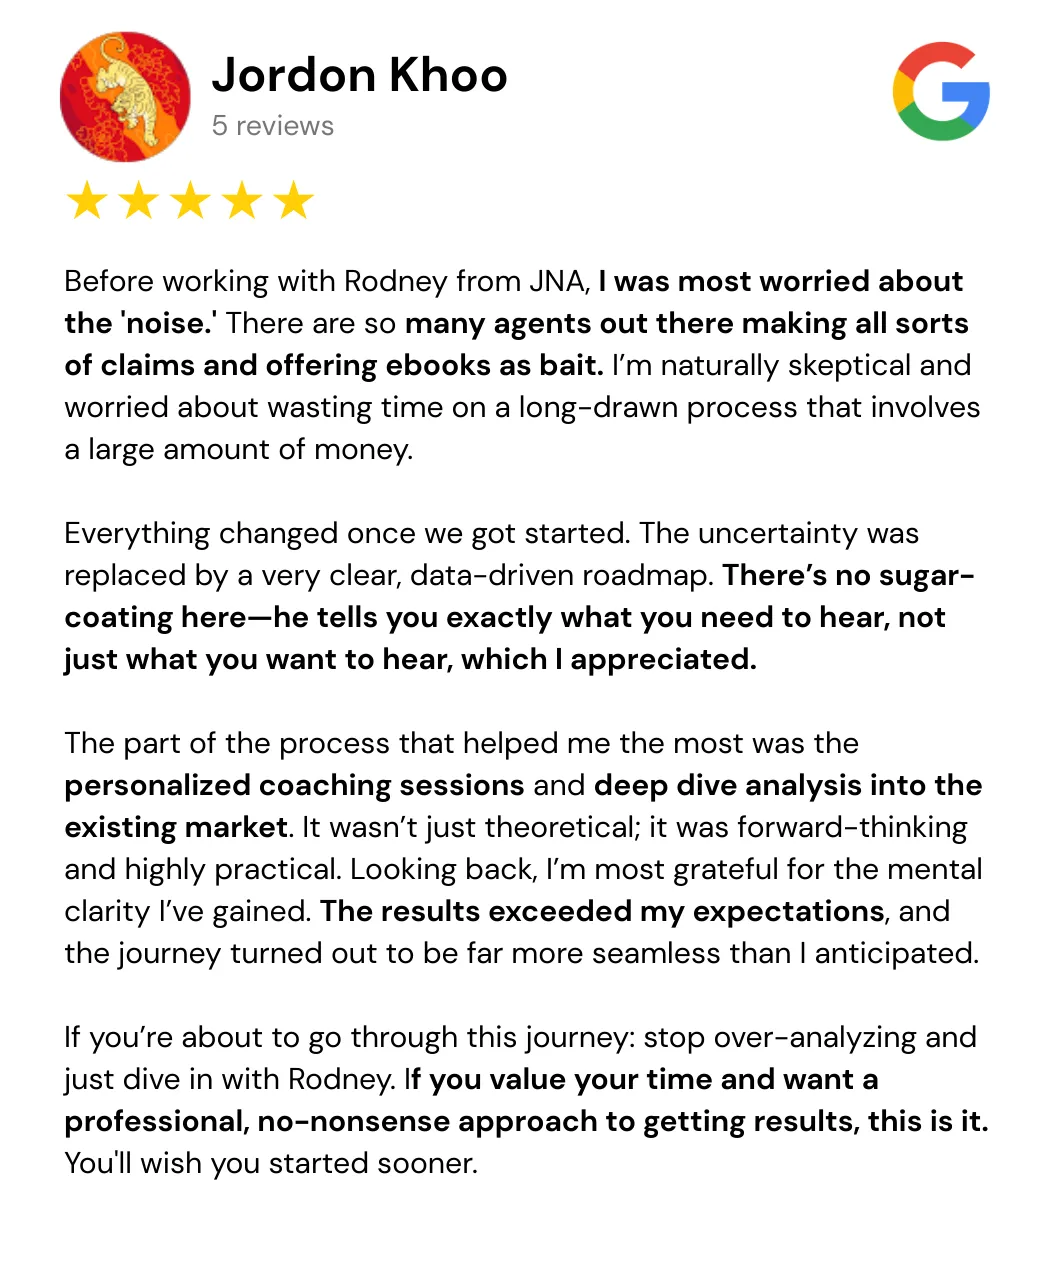
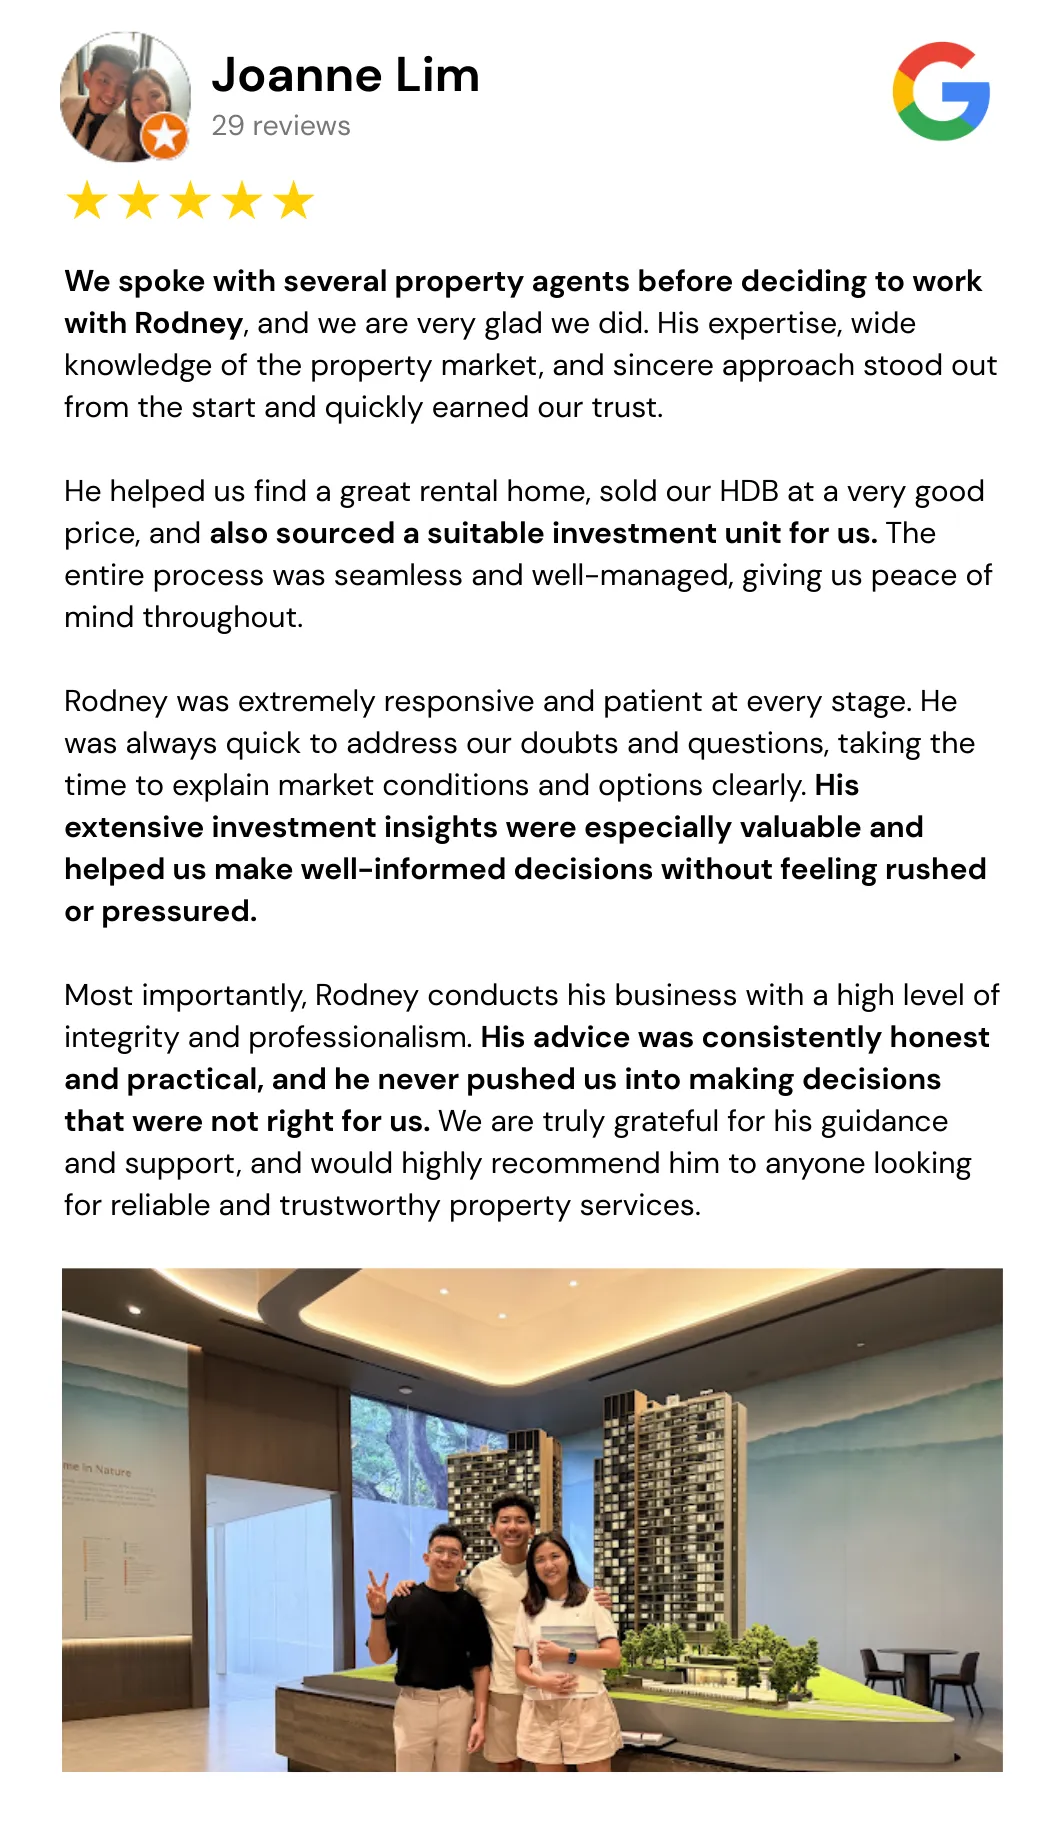
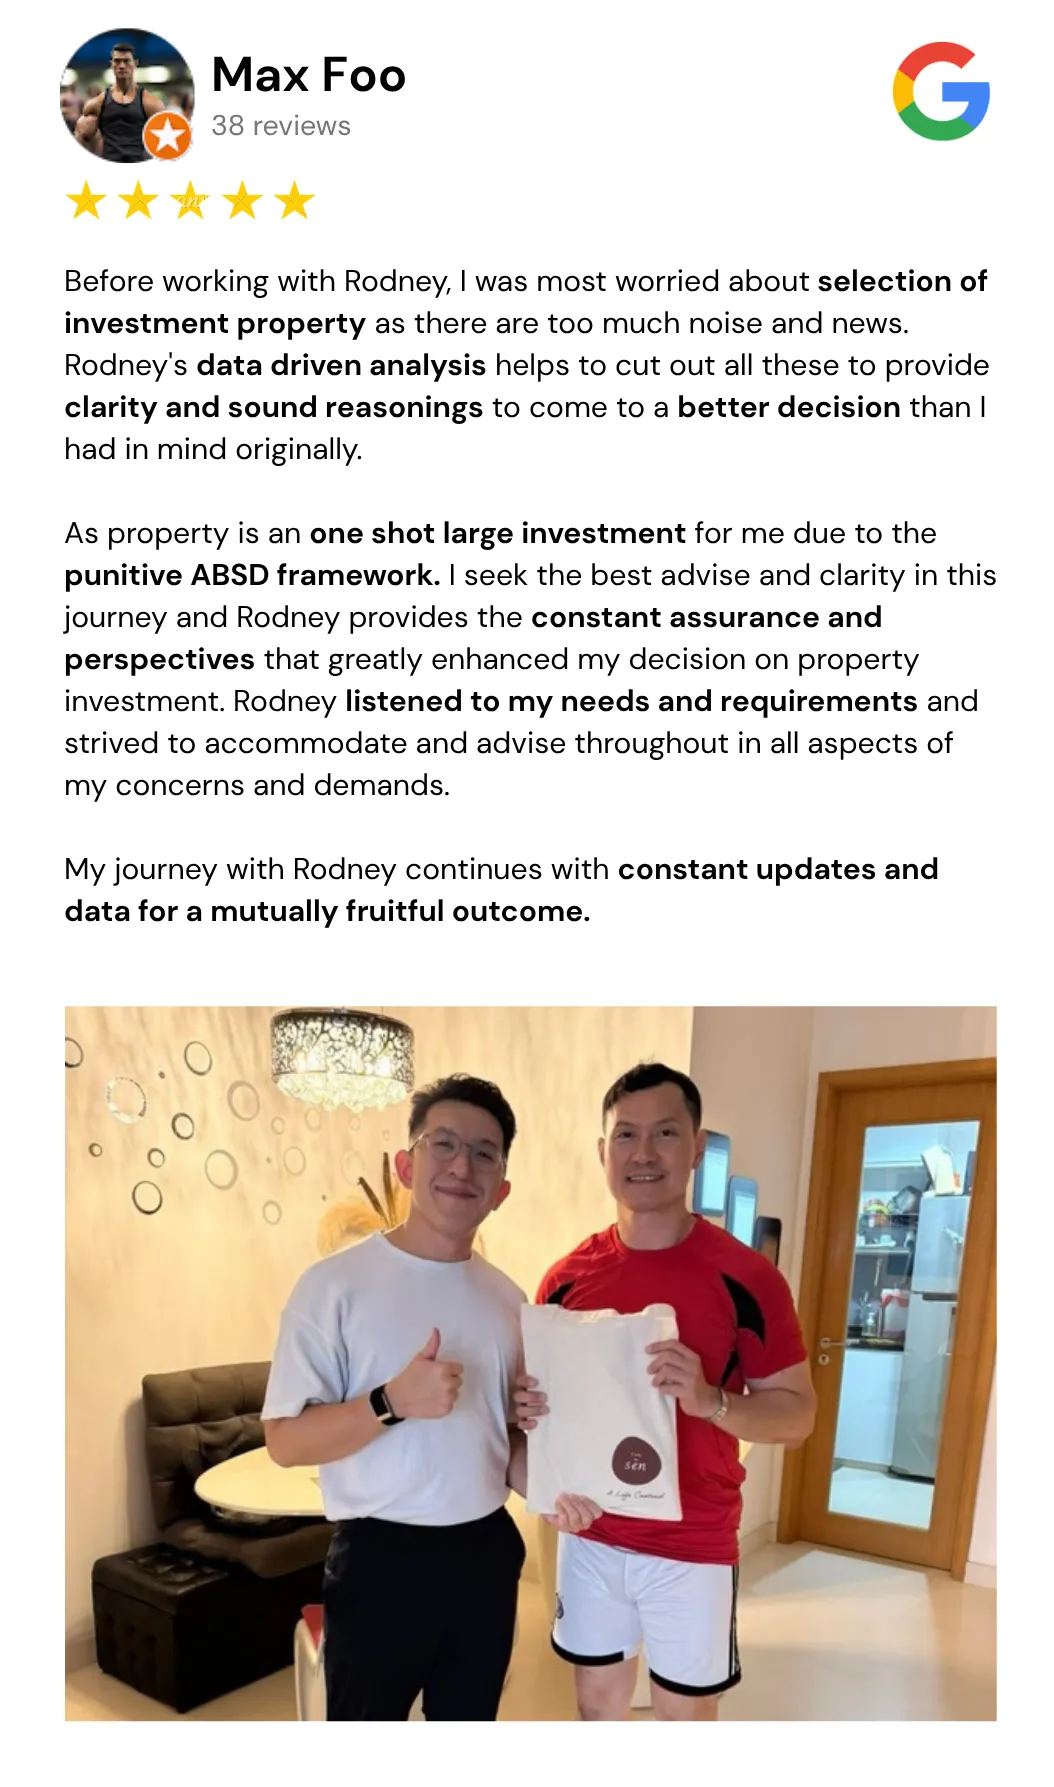
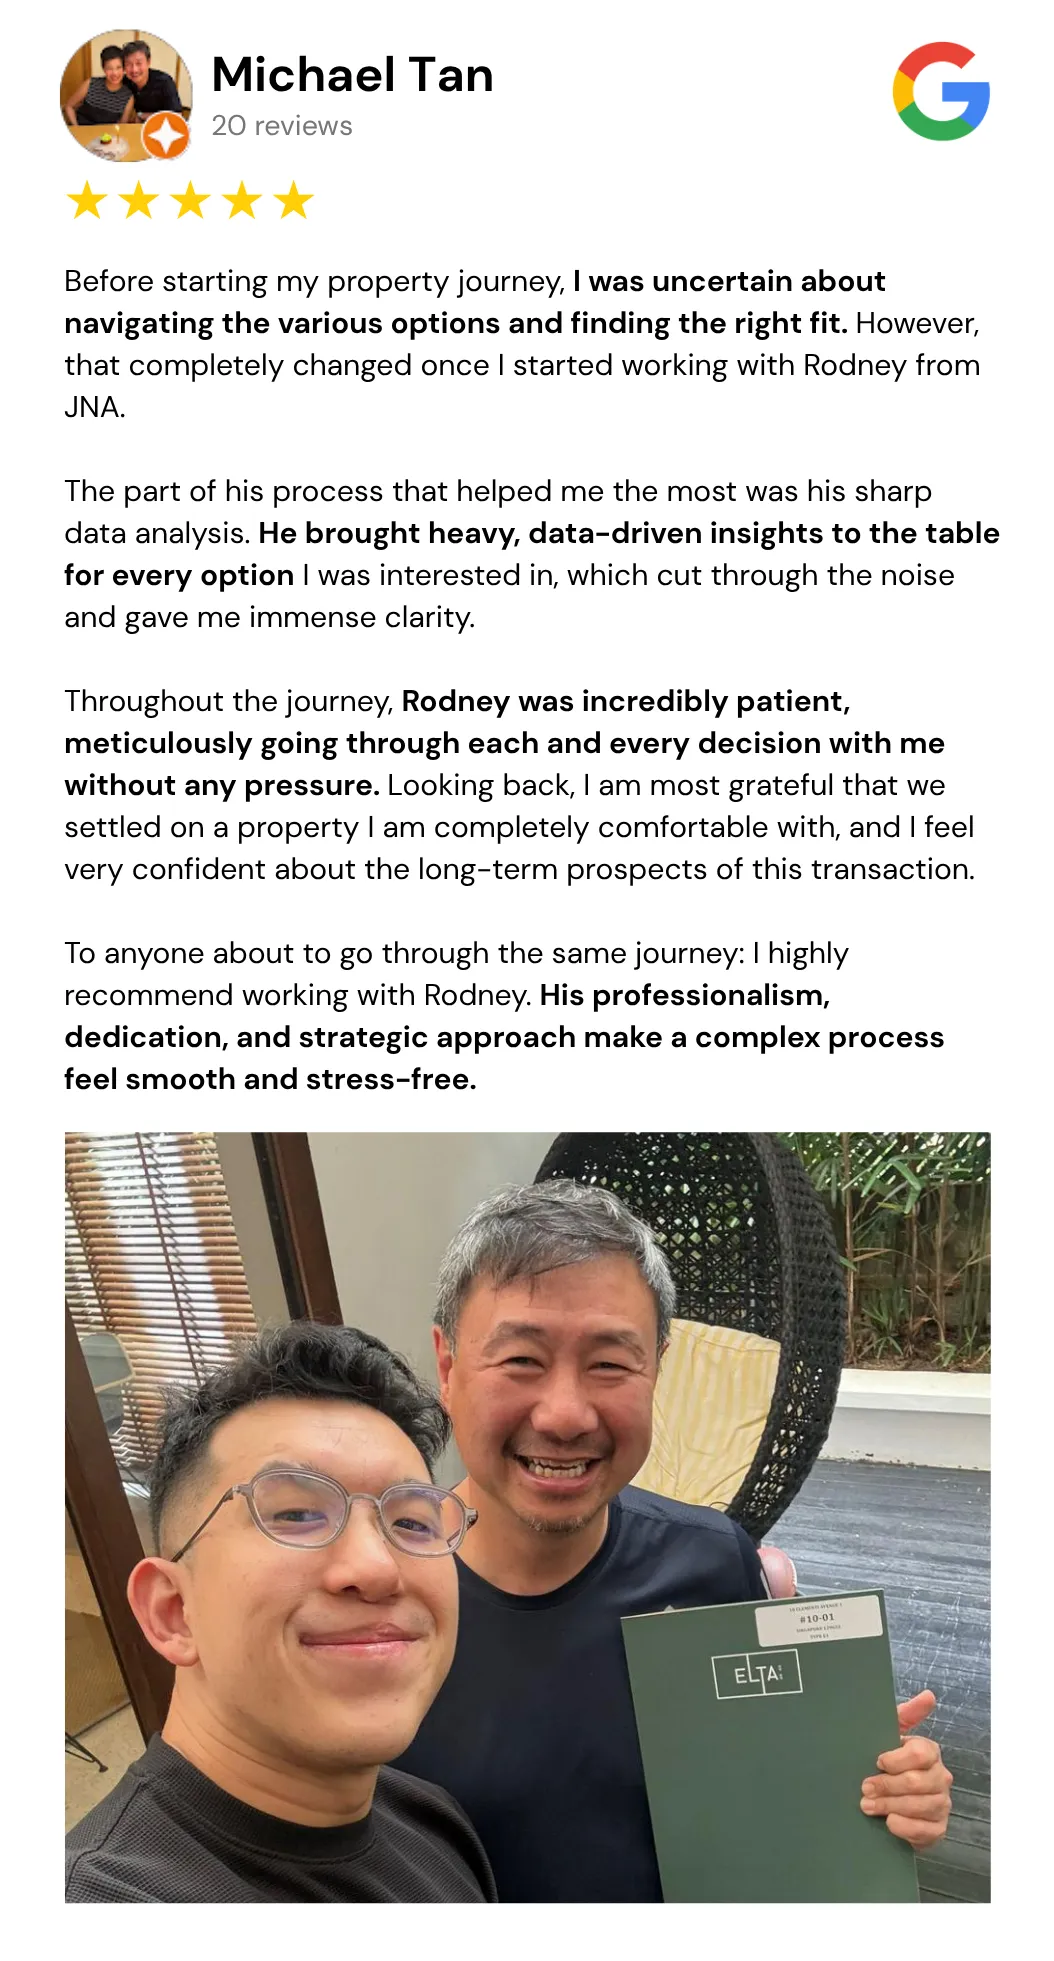
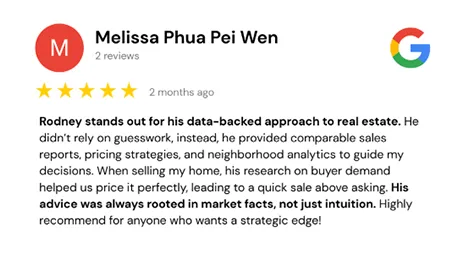
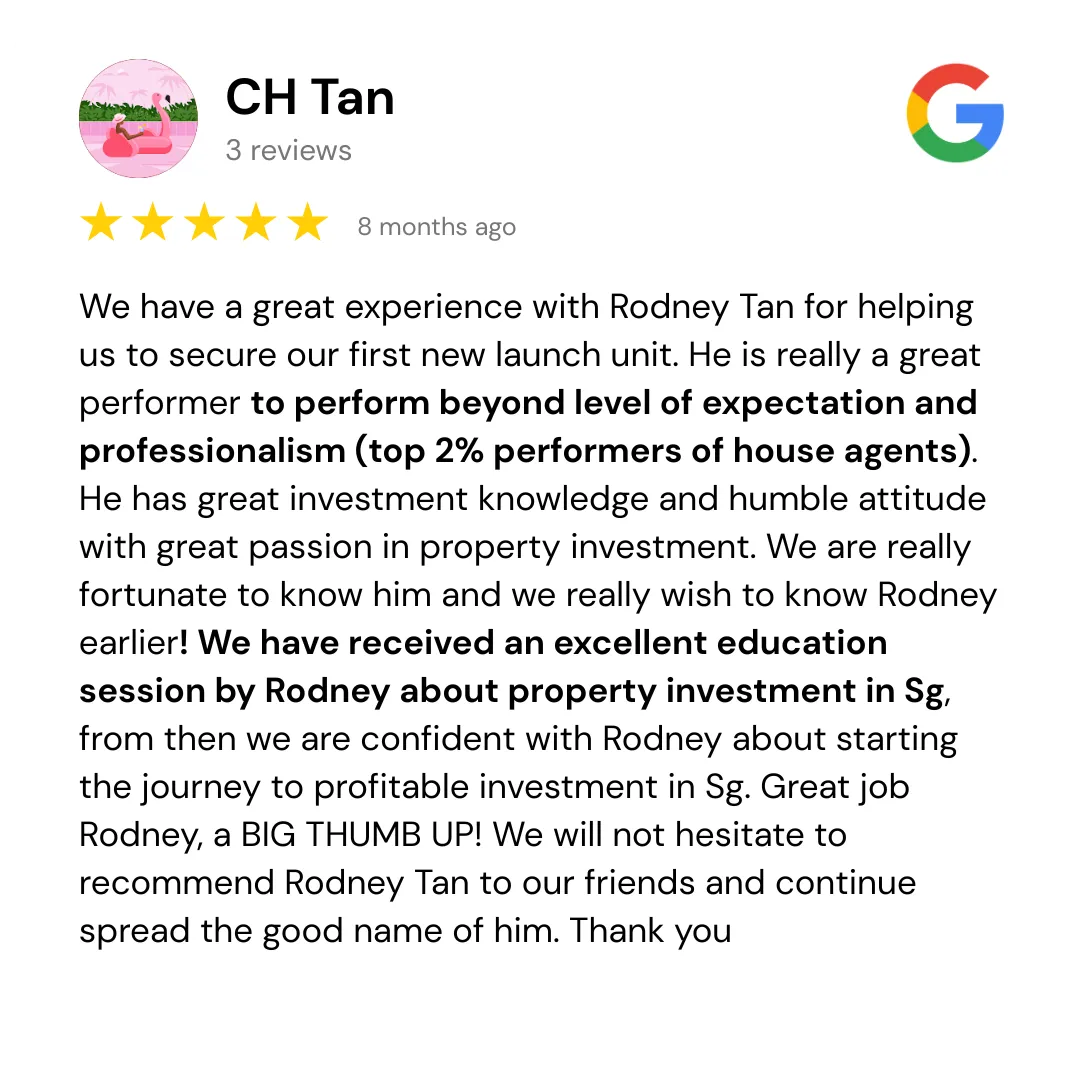
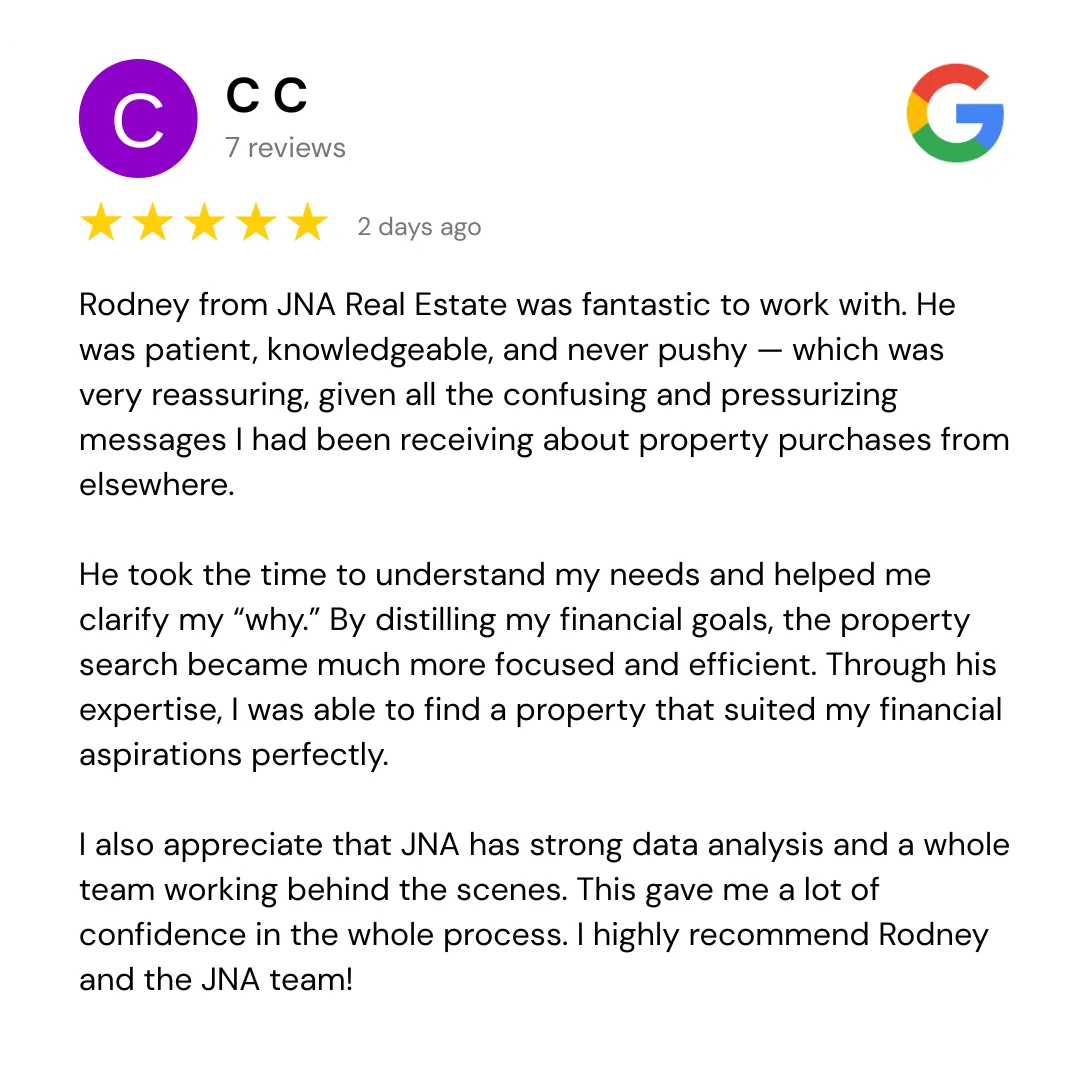
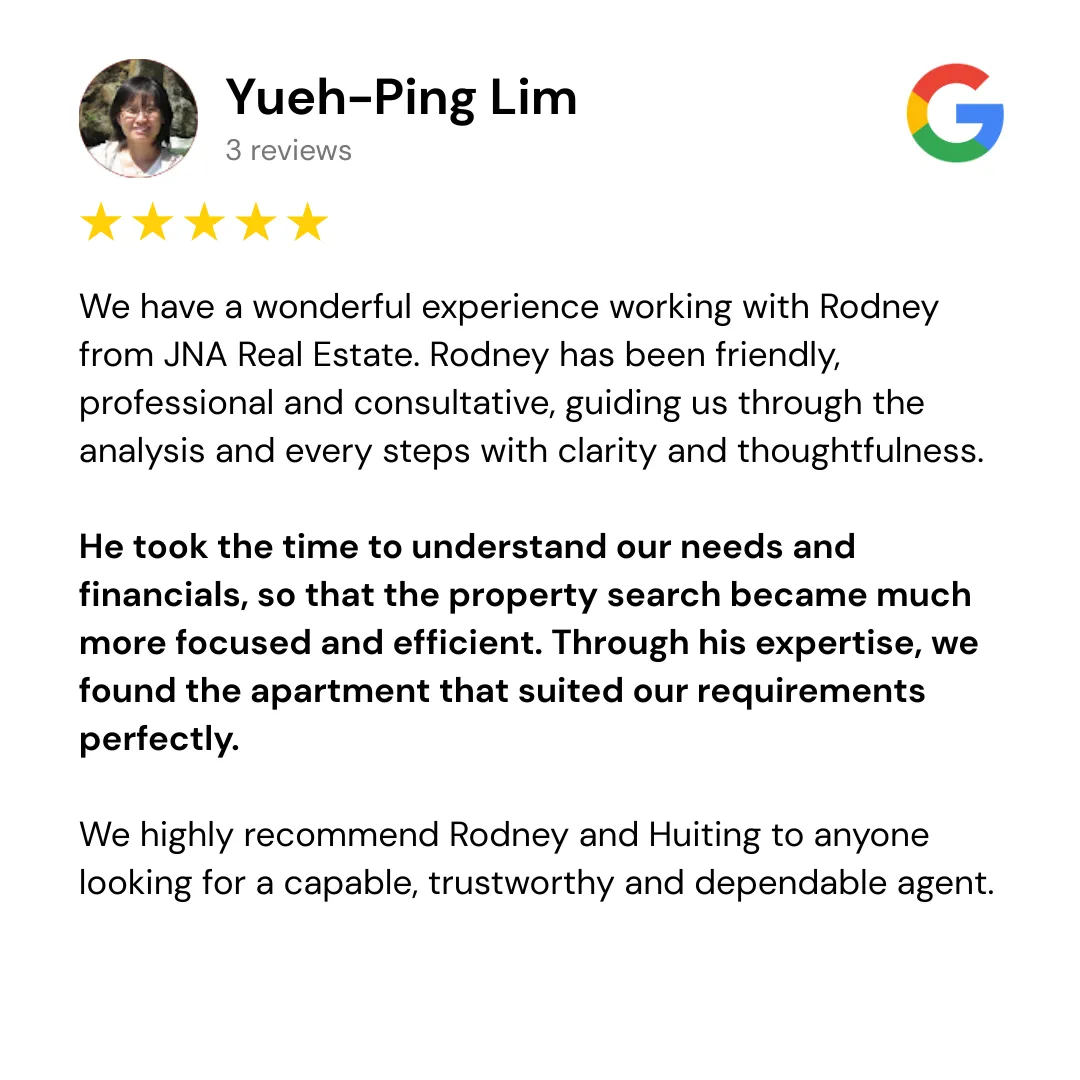
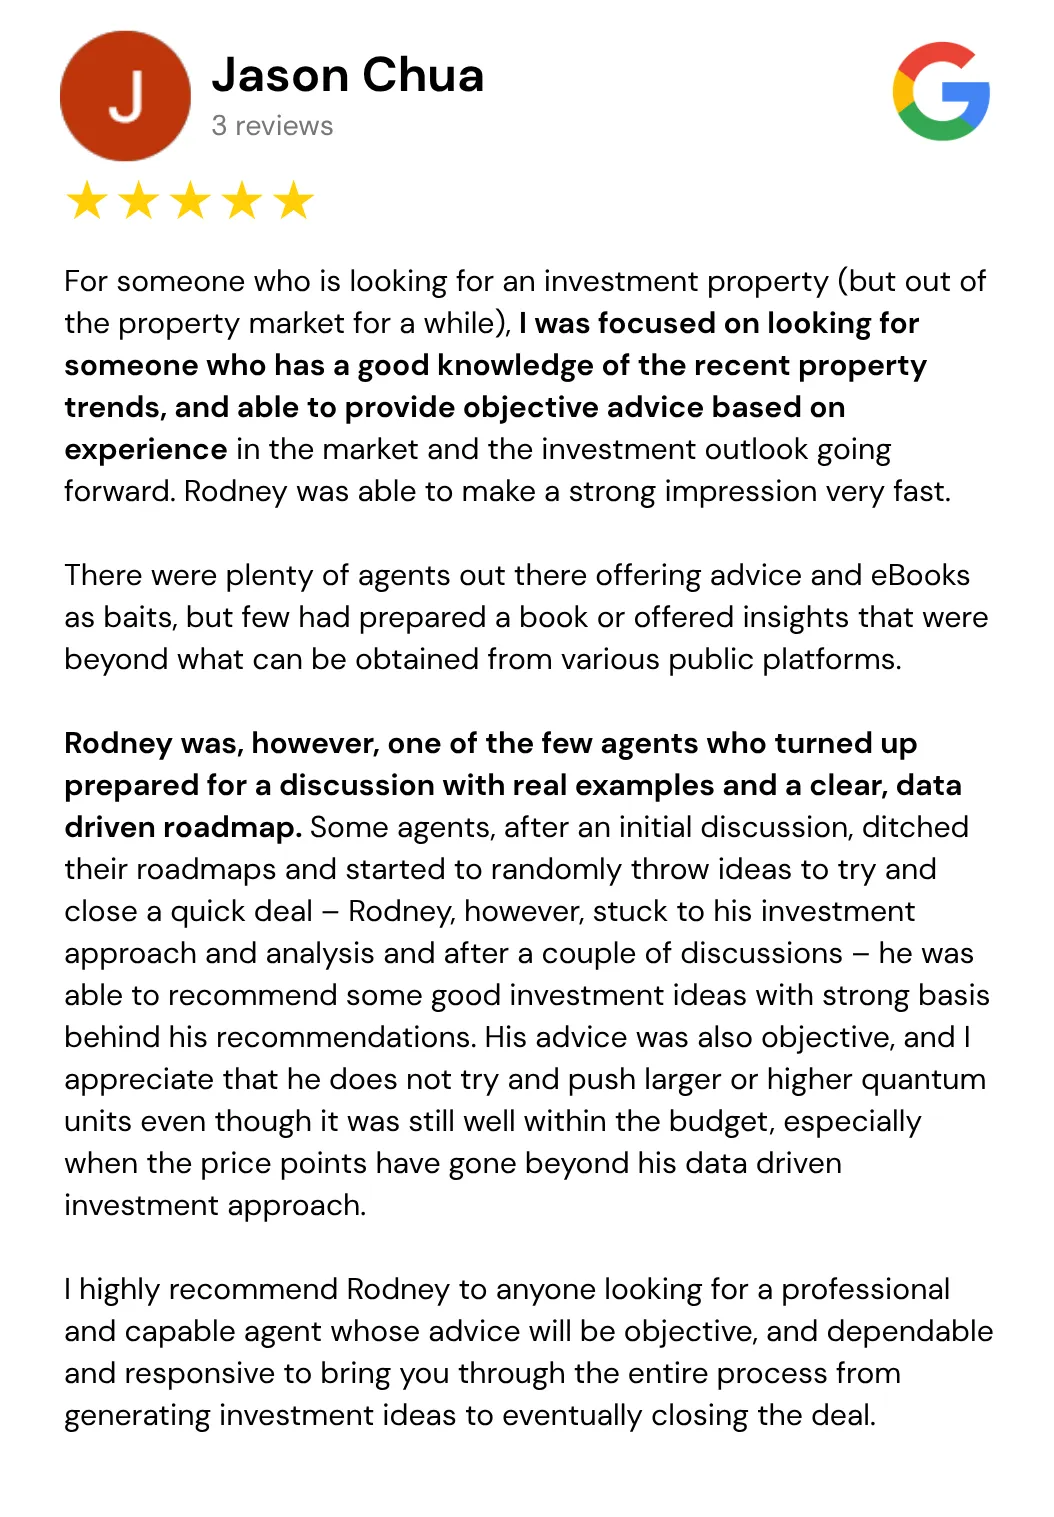
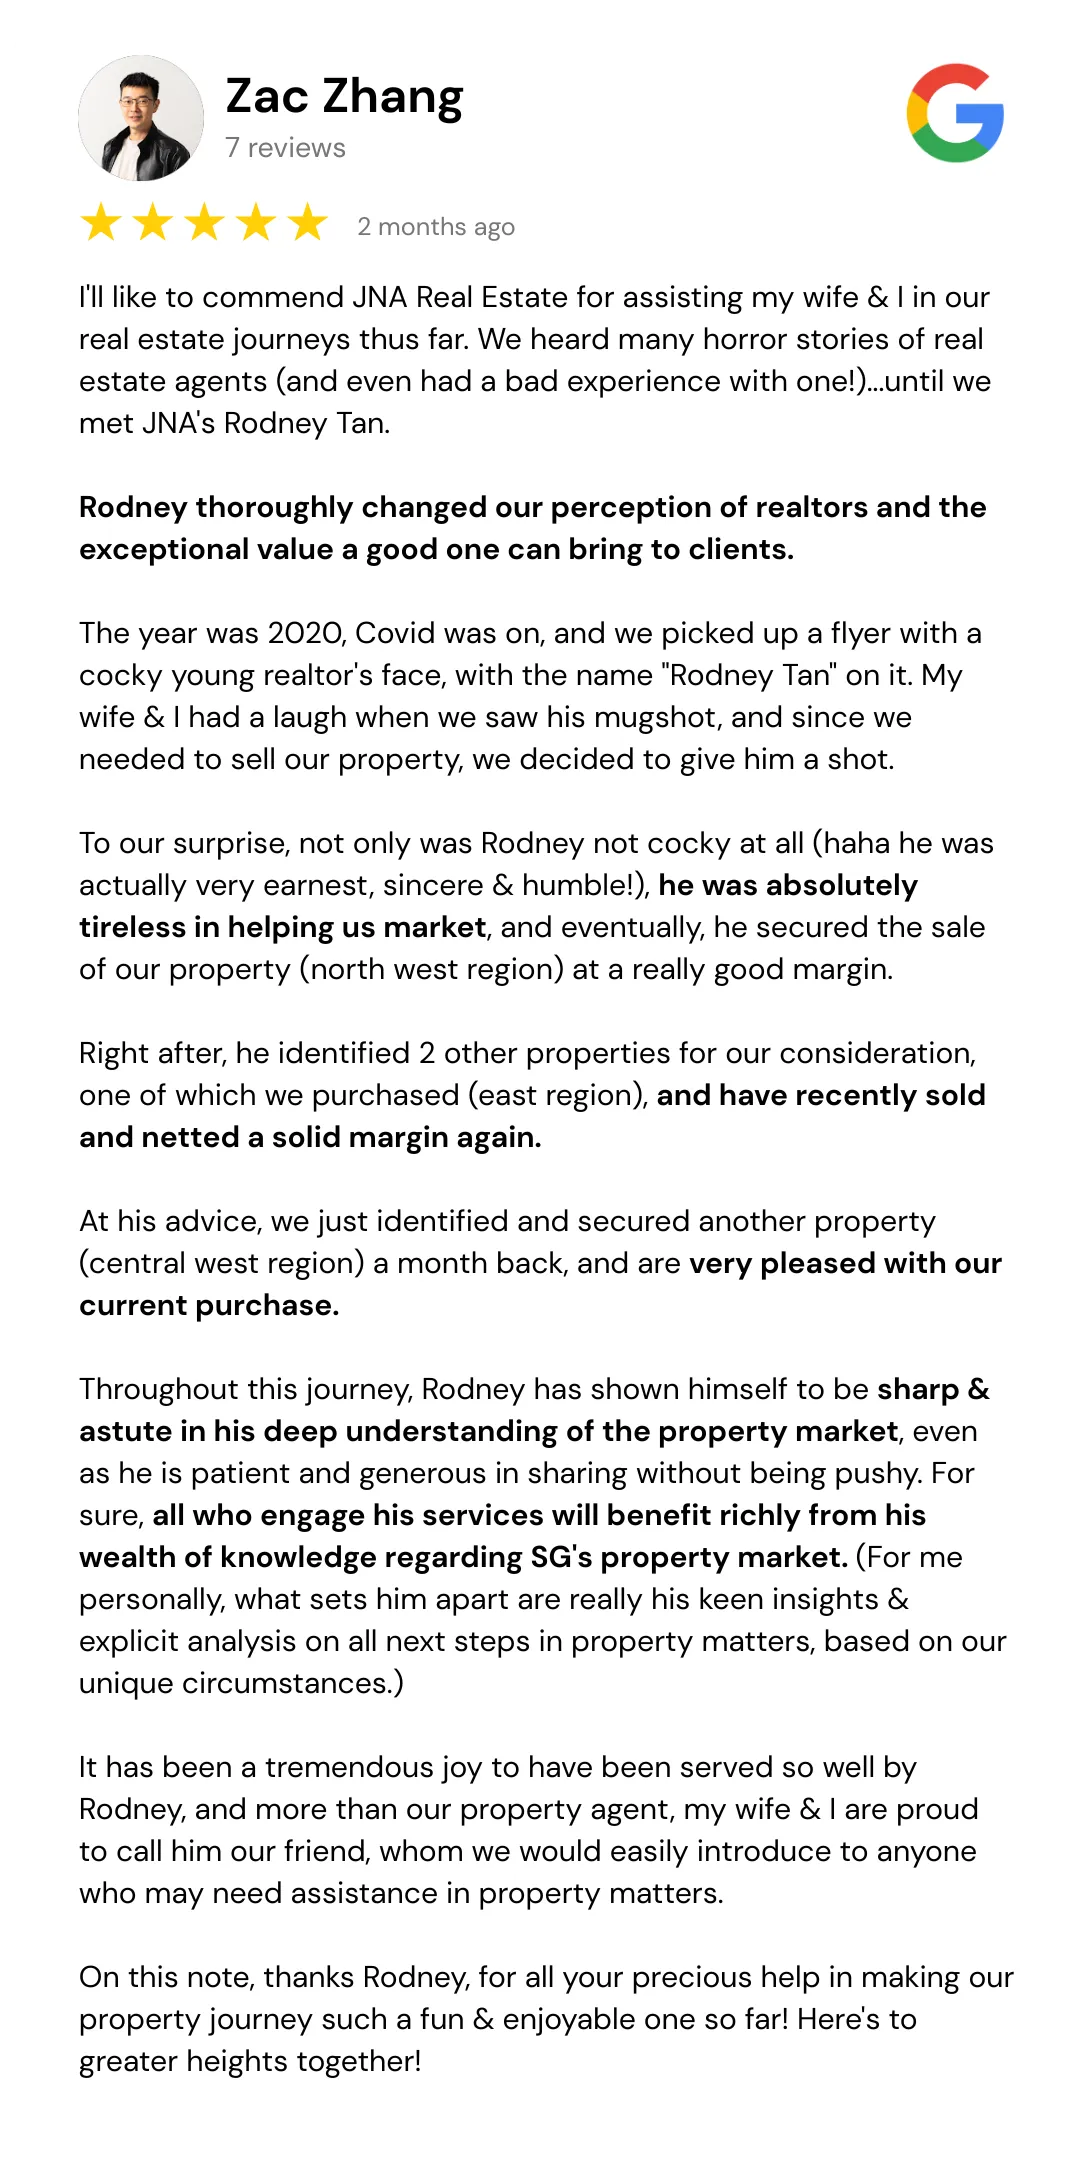
What People Say about Rodney's Real Estate Approach

These are screenshots of real Google reviews, unedited.
We chose these specifically because they describe what the experience of working with Rodney actually feels like.
From people who were once exactly where you are right now: considering this is worth the effort, probably a little skeptical, wondering if this would be any different from the last agent they spoke to.




Download the $700K Property Blueprint
Every property on your shortlist right now has a number attached to it that nobody is showing you.
The gap between what it will return and what a different property at the same price would have returned.
That gap doesn't become visible until years after you've signed.
The families on this page only saw it in advance because they checked 7 signals that most buyers and most agents never look at.
The blueprint documents all seven, with the transaction evidence behind each one.
Twenty minutes to read. Applies immediately to whatever you're comparing.
Copyright 2026. All rights reserved.